
Trip and Fuel Log Tutorial
Purpose
The trip and fuel log is designed as a spreadsheet for a daily travel log and to help keep track of fuel consumption. This tutorial will primarily focus on the fuel log as the trip log is self explanatory.
Trip Log
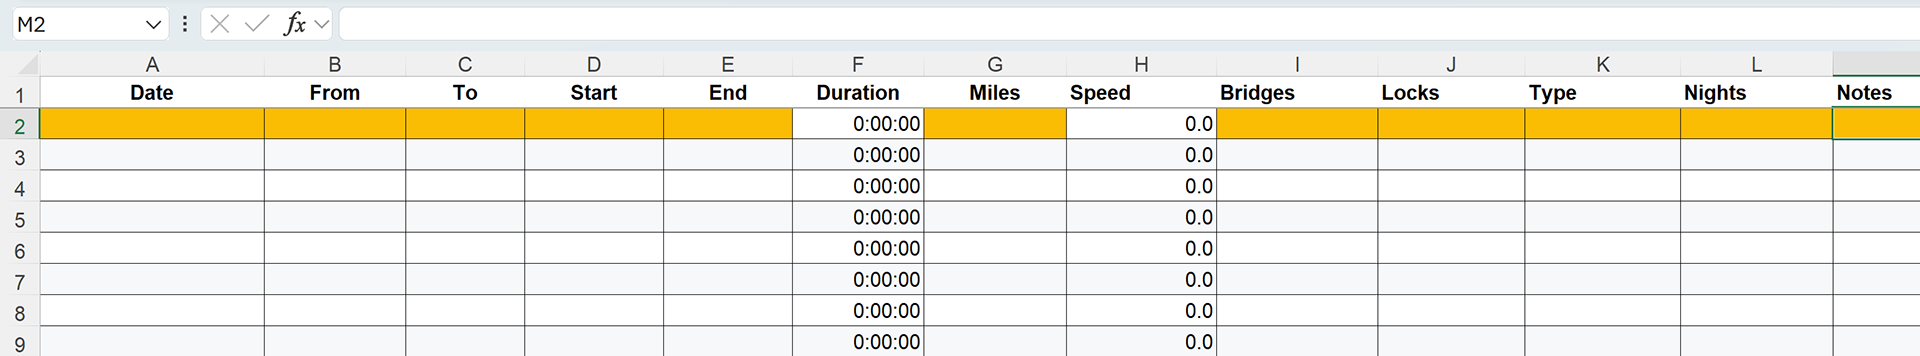
The areas in orange is the data you will need to fill in. Column K is drop down selection for anchorage, free dock, marina or mooring. The duration is calculated from the time you start (column D) to the time you end (column E). The speed is calculated from your total miles and the time of travel. The notes section is where you will put your trip observations.
Fuel Log
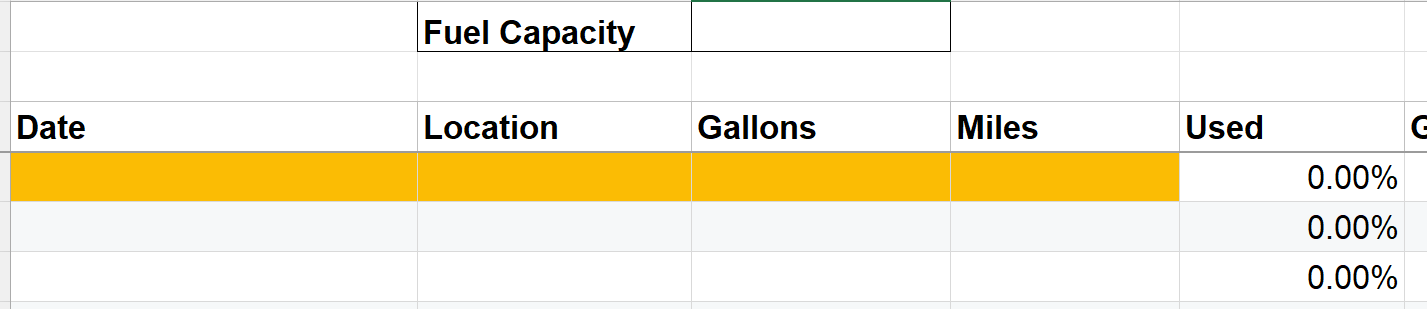
The fuel log is a little more complicated. The basis for the fuel burn is not necessarily the amount of time you traveled, but the amount of time your engines are running. Engines idling, waiting to go, are still burning fuel. These calculation are for those boats that may not have fuel flow monitors or just want to check the calculations. To start, you will need to note your fuel capacity of your onboard tanks. Take the boat and fill the tanks. Note the current hours of your engines after the fill up to start tracking data. It is important to be as precise as possible and not to forget the generator hours if it runs off your installed tanks. It is important to note your current engine and generator hours as starting hours after you have filled your tanks for the first time before starting this sheet. This is the basis for all future calculations and only has to be this way one time. All future hours will be entered on the main sheet.

Once the starting data is entered, you will start tracking the fill ups. If you do not have digital gauges, try to fill the same way each time. If you fill till you hear the gurgle, do that every time, if you only partially fill, it will require some math on your part to get the numbers correct as the sheet does not calculate partial fills. When you fill up, note the date (mm/dd/yyyy), the location, how many gallons you filled, and how many miles since the last fill up (you can get this from the trip log).
The next area is the logging of the engine hours and fuel cost. Enter in the generator hours, the port engine hours and the starboard engine hours. Depending on how the boat is run, the engine hours may not be the same.
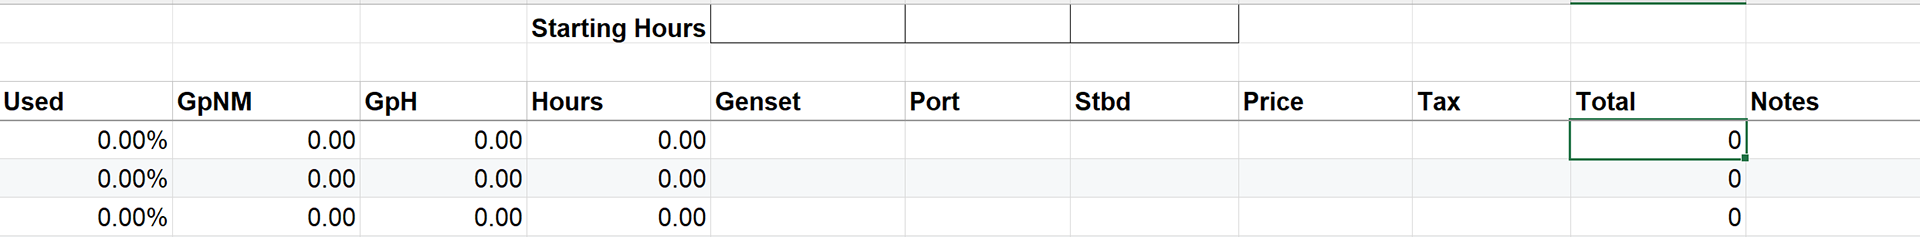
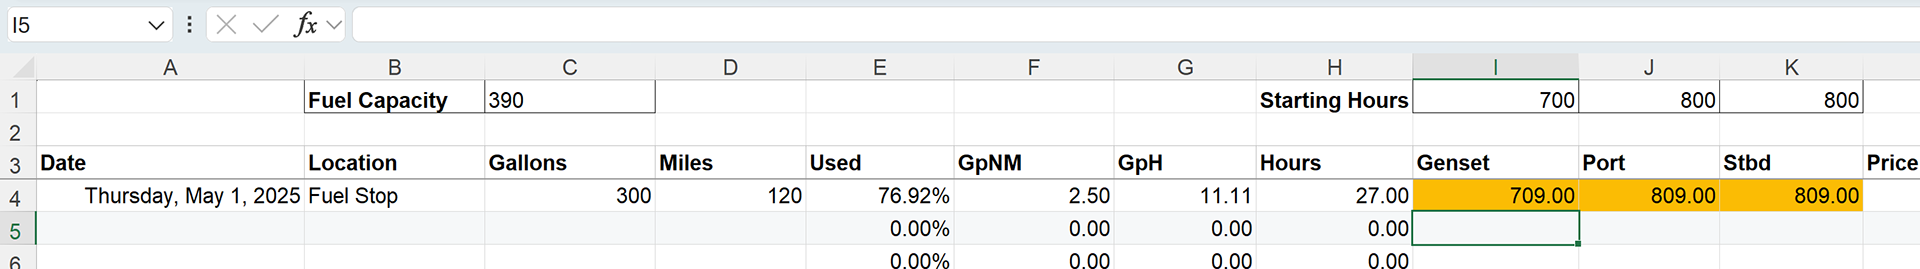
Once entered the first row subtracts the hours from the starting hours, but each subsequent entry subtracts from the cell above it. This logs the hours between use. Since the fuel data is based on over all fuel consumption, the hours are added together. Making our first fuel stop and entering in the data, we can see that we used 76.92% of our total fuel over 120 miles and a total of 27 engine hours combined. We burned 2.5 gallons per nautical mile and 111.11 gallons per hour. We showed our engines as 1 hour longer than our trip time of 8 hours, this is not uncommon as diesels are usually running a short time before actually departing on the trip. The rest of the sheet is tracking fuel prices and anything of note during the fill up.
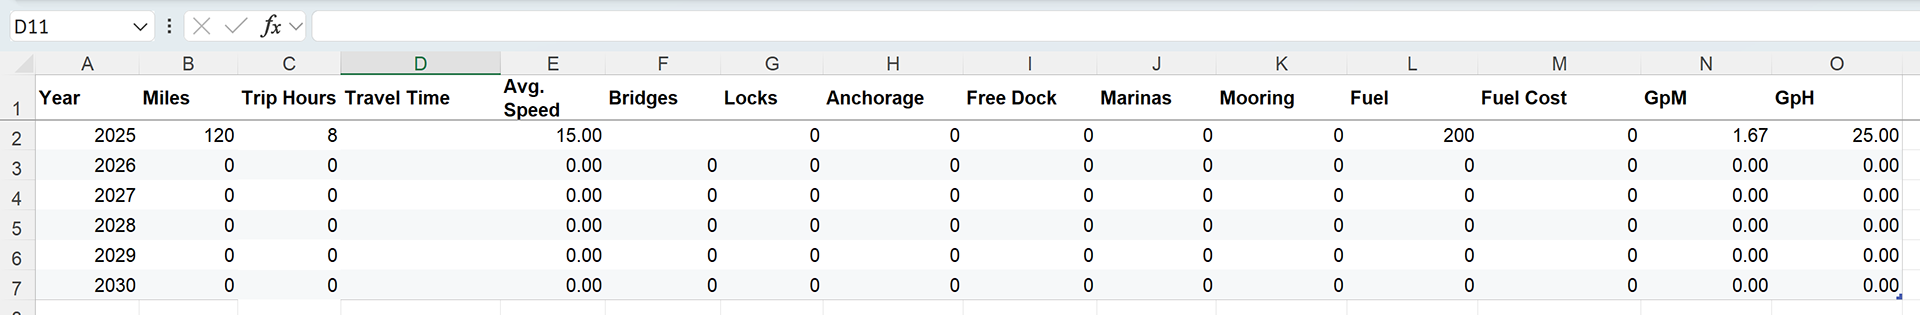
The Summary Sheet
The summary sheet pulls data from the trip and the fuel logs. Enter the year you are going to track in column A. As long as you have entered dates on the other sheets, only the designated year in column A will be pulled into that row. There is no data for you to enter on this sheet.
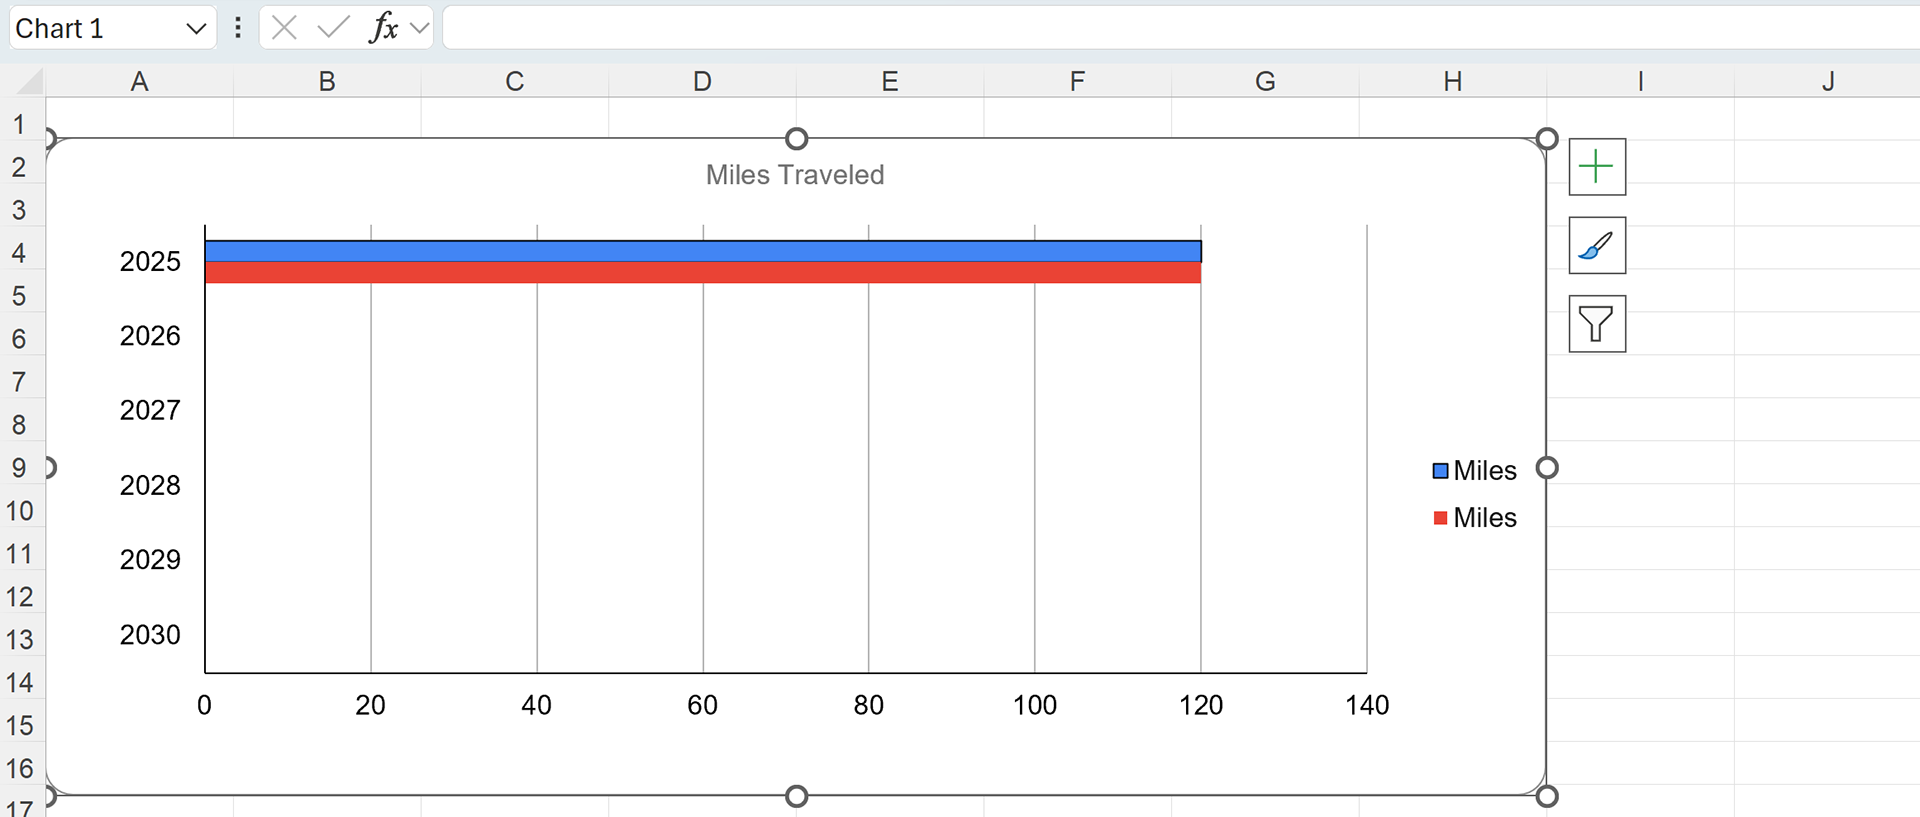
Charts Sheet
Unfortunately this gets a little tricky when converting from Google Sheets to Excel during the export function. The two products do not set up charts in the same manner so you have to a little to get them to function correctly. Start by selecting the chart sheet and clicking on the chart at the top of the sheet. A side menu will appear for options of that chart.
Click on the '+' menu at the top of the menu stack. This will open the chart elements side menu.
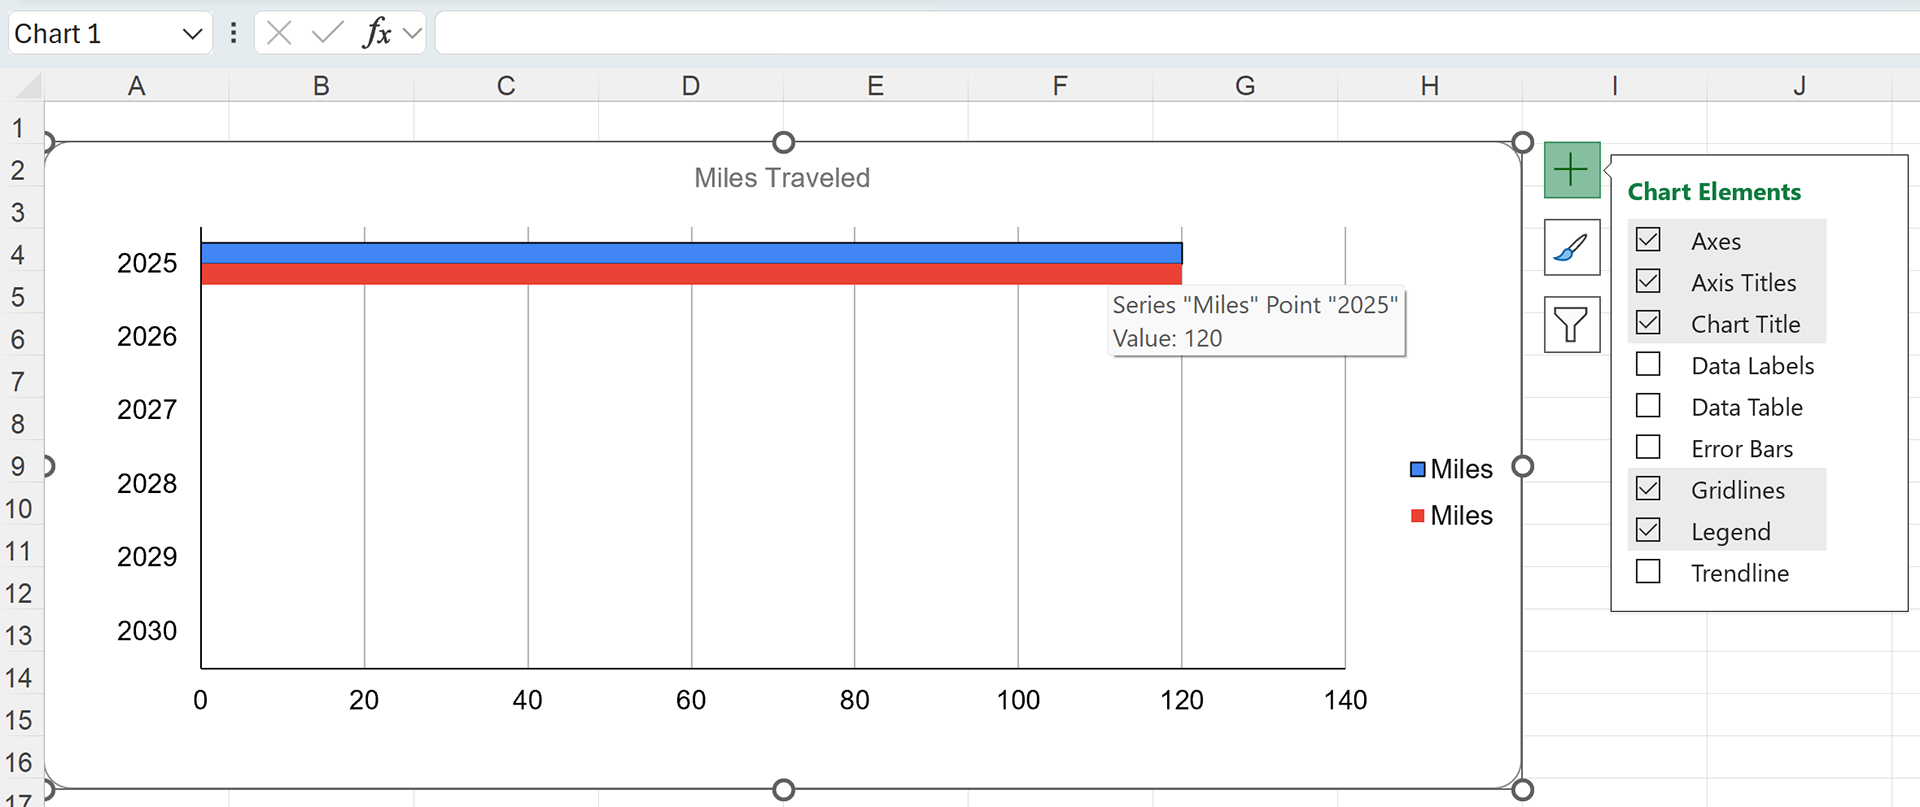
Click the box for Data Labels to be displayed.
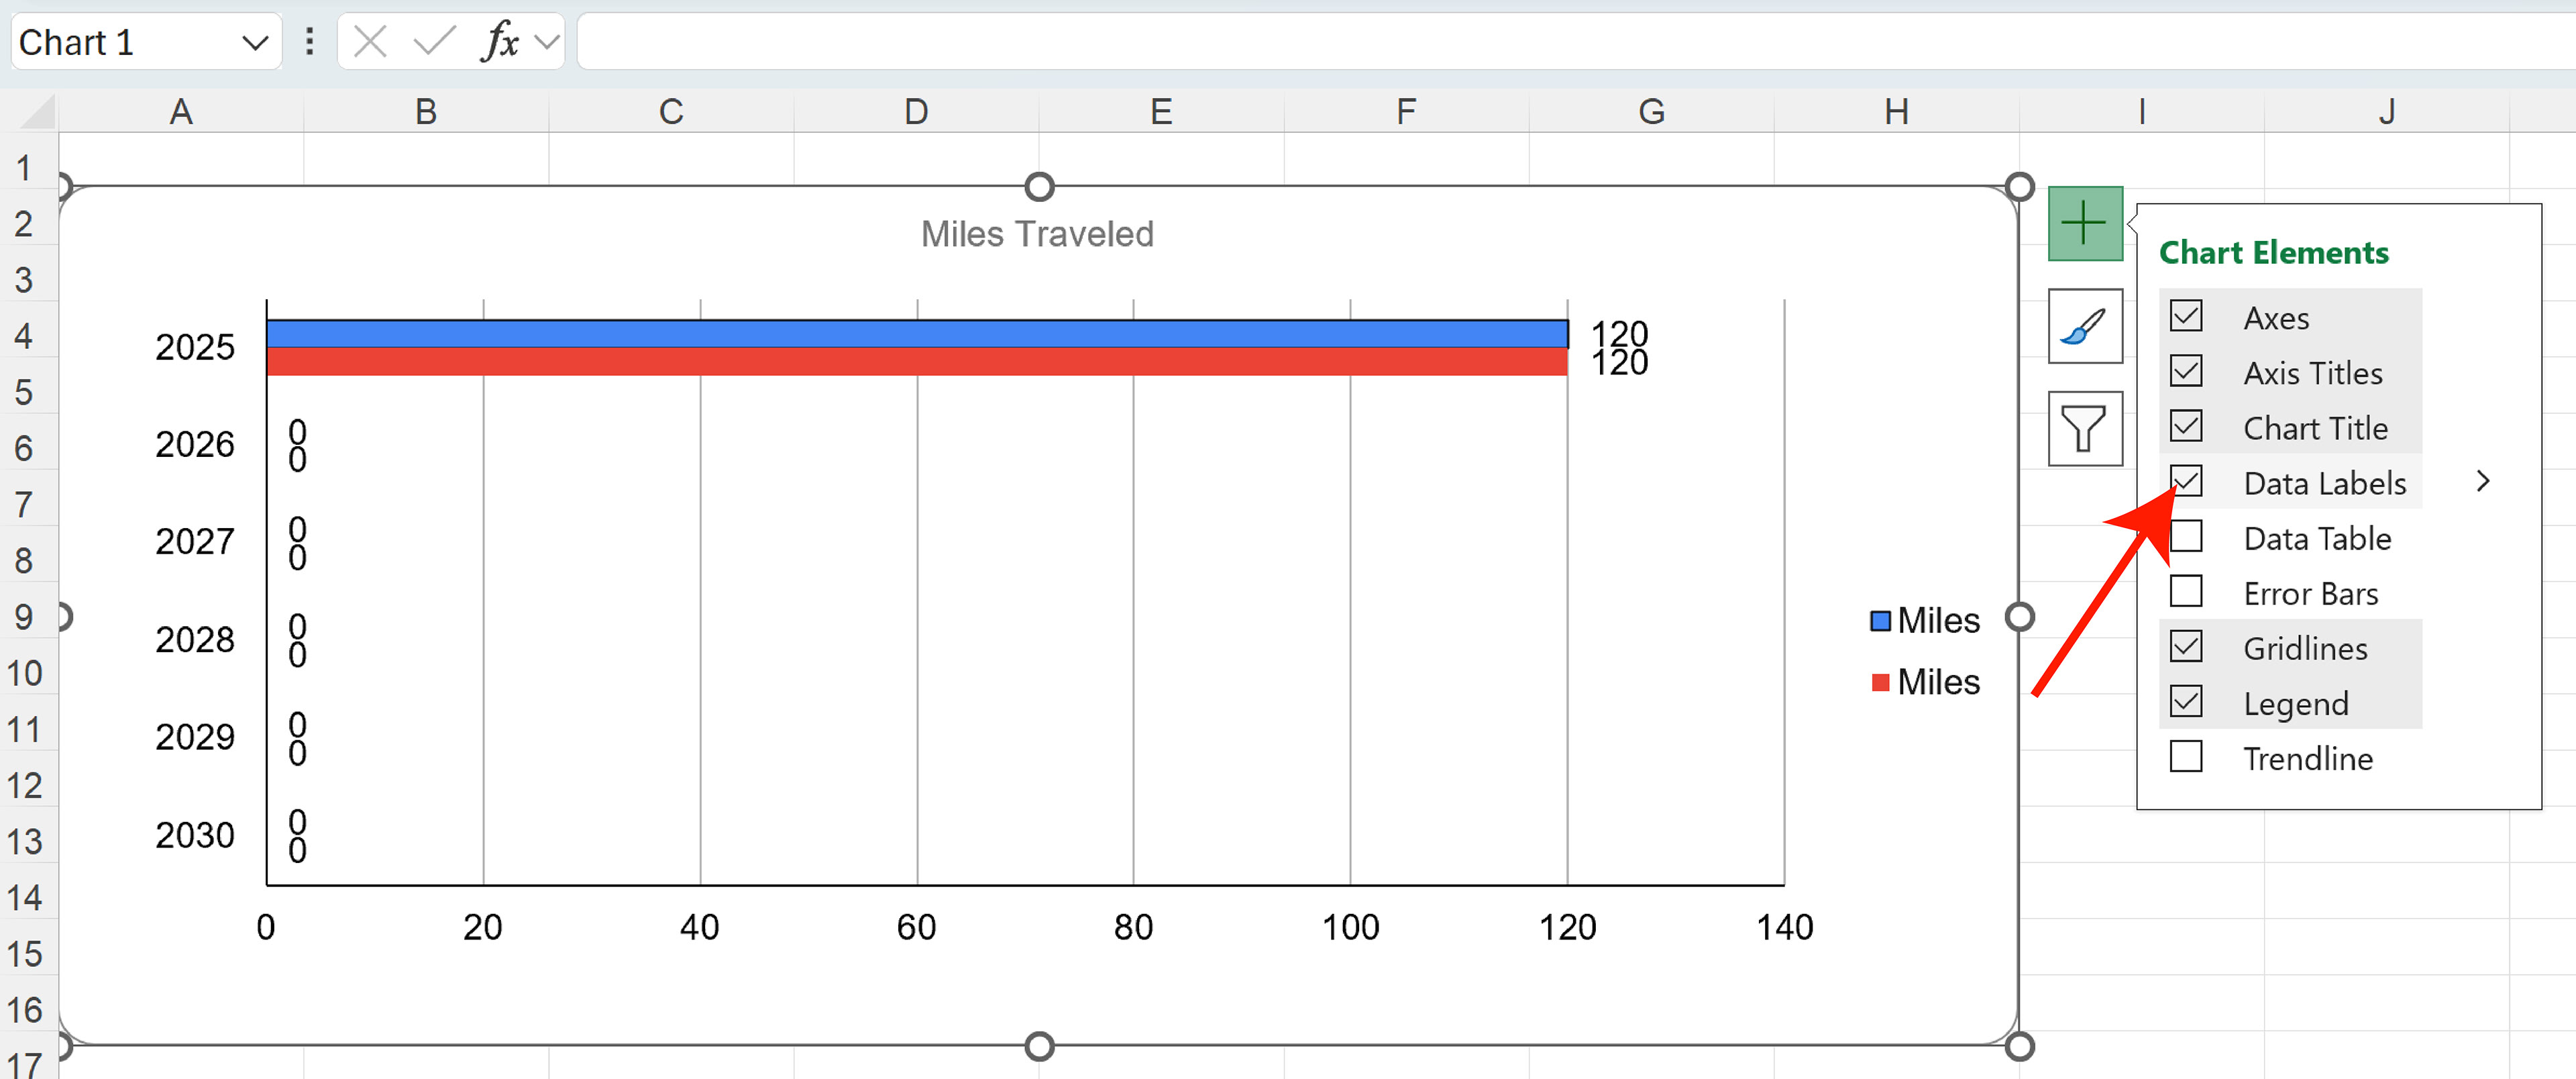
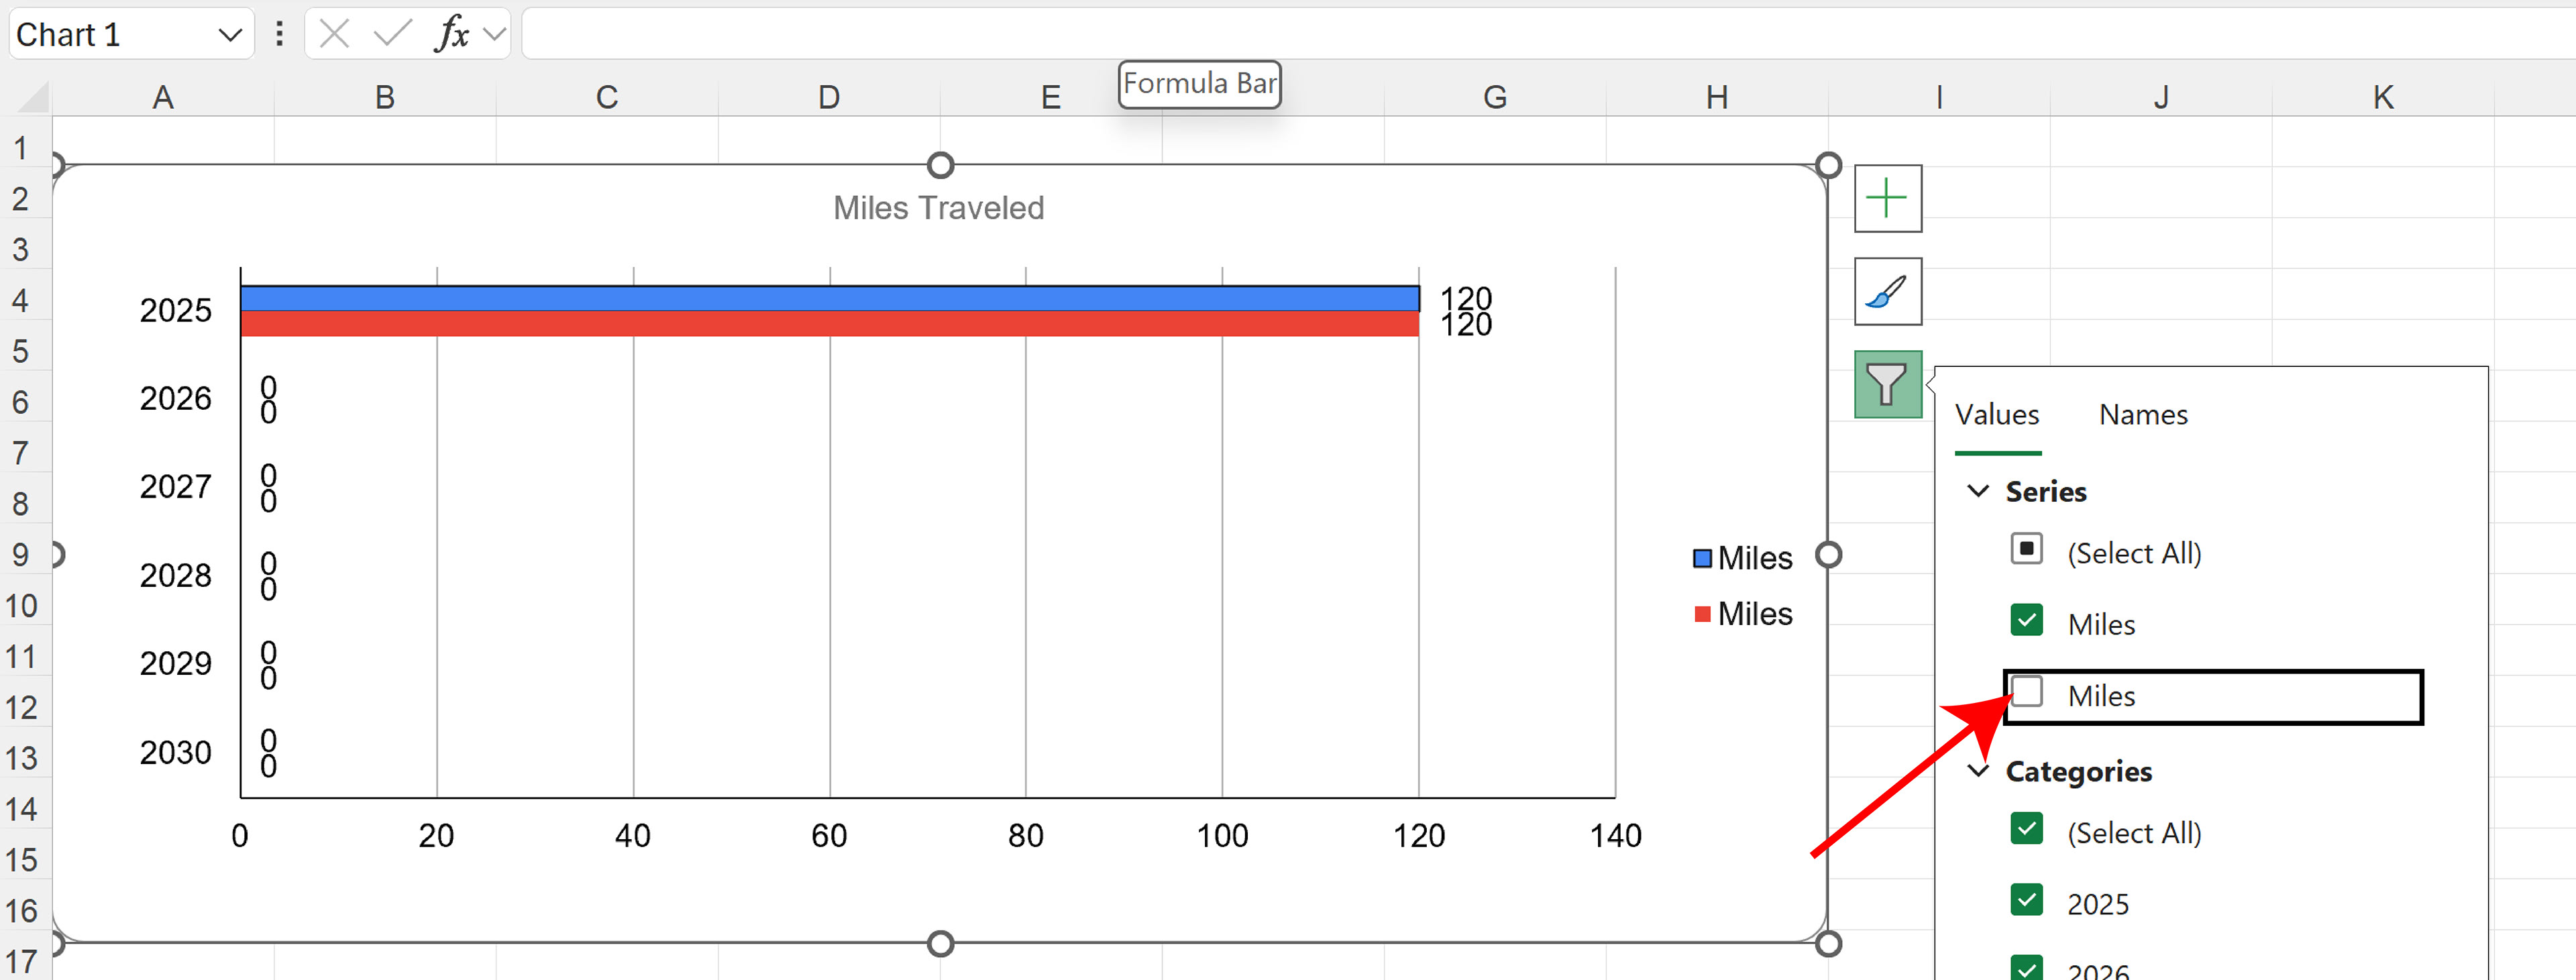
With the side menu still open, click the bottom icon that looks like a funnel. This opens the "values" menu.
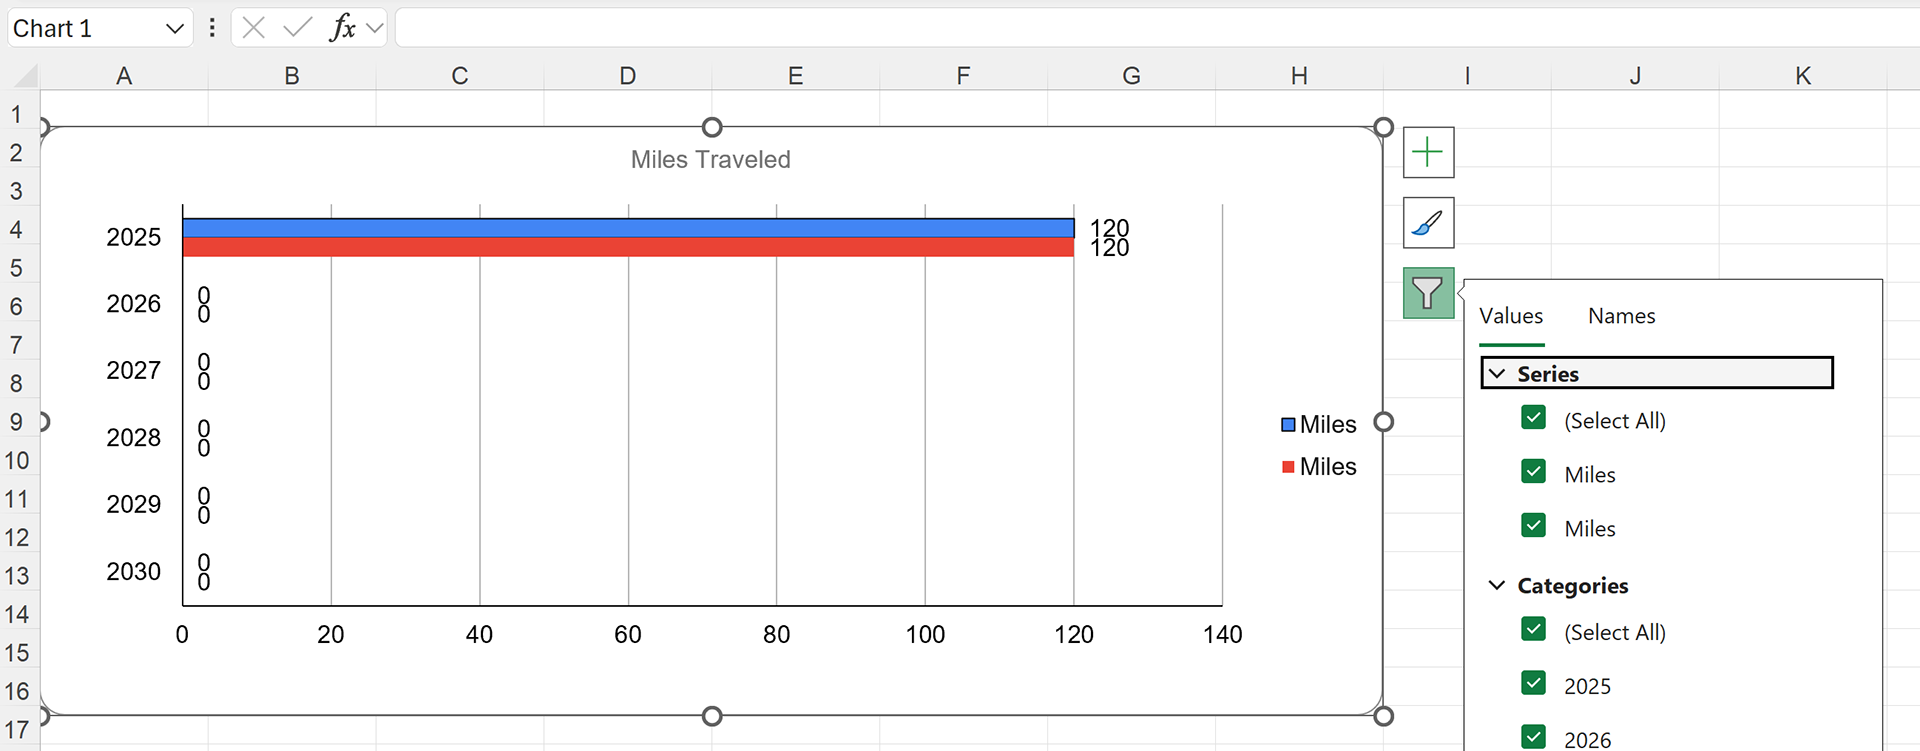
Click on the bottom option of the series values and uncheck this box. At the bottom of the menu click "Apply". Click any where on the sheet outside the side menu to close it.
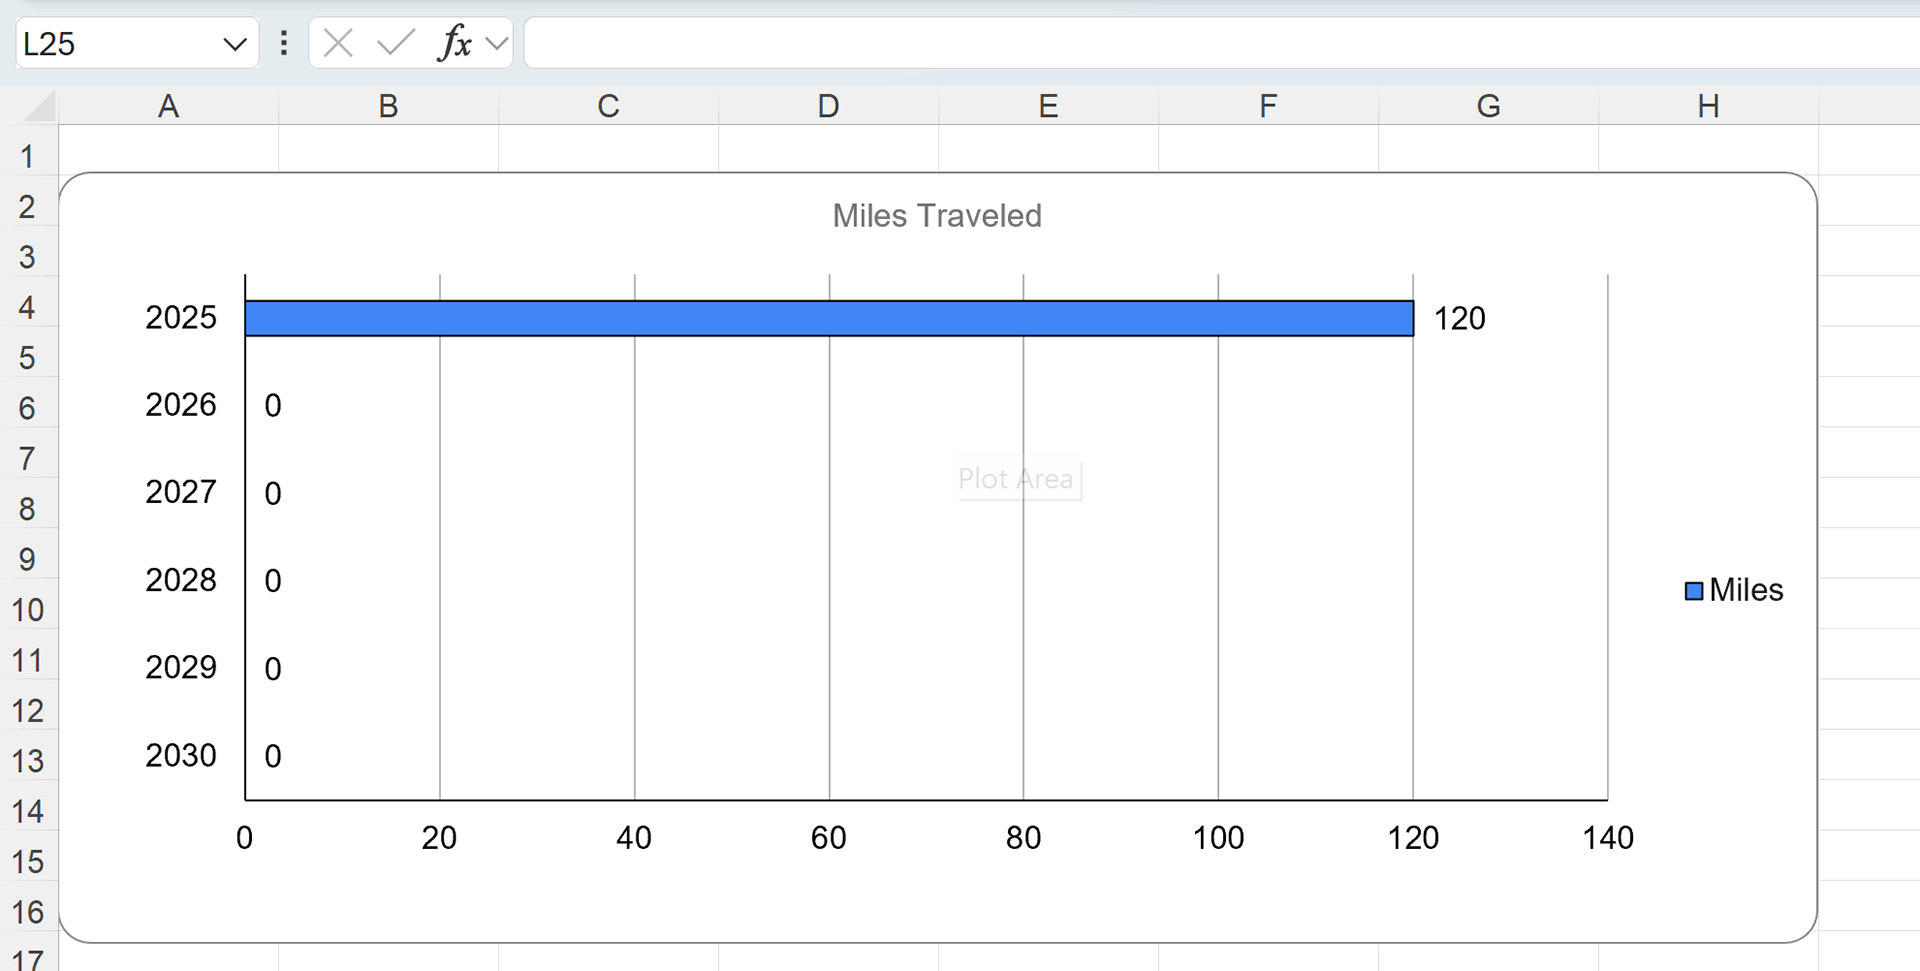
The chart is now formatted correctly. Save the document. You have to repeat this process for all four charts so they appear correctly withing the sheet.
All data on these charts are pulled from the other sheets, there is no data to enter for the charts to graph.